Posts under UCLA

<<< Back to Blog Home
Search Our Blog

UCs v. the Ivy League

What Makes UC Berkeley, UCLA, and the UCs Unique

July 30, 2020 by Veritas Essays Team | UC, UC Berkeley, UCLA, Ivy League, Admission, Chances


The University of California schools (UCs) are a collection of public universities and institutions located in California, comprised of 10 campuses, 5 medical centers, and 3 national labs.

The Ivy League, on the other hand, is a collection of 8 private universities in the Northeast . They receive far fewer applicants per year — UC Berkeley and UCLA receive 88,000 and 110,000, respectively, while <40,000 apply to Ivy League colleges on average.

However, the Ivies also have much lower acceptance rates , all at <11% versus 16% and 17% for UCLA and UC Berkeley, respectively .


The distinction between the University of California schools and the Ivy League colleges can be most clearly seen by comparing the UC system’s two most famous members UC Berkeley and UCLA — to the Ivy League.

With its close ties to Hollywood and Los Angeles, it’s no wonder that UCLA has a long list of prominent alumni who’ve made strong contributions to music , theatre , and the arts .

The Ivy League has much weaker connections to industry than UCLA, which is why UCLA has the #4 ranked film program and #1 ranked theatre program in the nation.

UC Berkeley is the engineering powerhouse of the group. It is the oldest of the UC schools, having been founded in 1868, and has had a total of 107 Nobel laureates pass through its gates, the 3rd most of any university in the world.

UC Berkeley is mainly known for its strength in engineering and CS , counting Steve Wozniak (co-founder of Apple) and Eric Schmidt (ex-CEO of Google) among its alumni.

If you graphed the performance of students as a bell curve, the “ tail ” of weak performers at Berkeley and UCLA is probably longer than the tail of such students at a school like Harvard or Yale.

However, at the top of that curve, students at both schools will be virtually indistinguishable , and the faculty at UCLA and UC Berkeley is similarly top-notch (if not substantially better in certain fields).

Both are fantastic schools; just because they aren’t “Ivy League” does not mean they aren’t as good, if not significantly better in some fields, than schools like Harvard, Columbia, Princeton, etc.

Does Your Choice of Major Impact Your College Admissions Chances?

Be careful when "declaring" that you're an undecided or undeclared major

July 04, 2020 by Veritas Essays Team | Declaring, Majors, Advice, Admissions, Application, Mistakes, Carnegie Mellon, Cornell, UCLA, UC Berkeley, Harvard, UCs


Should I declare an intended major on my college application?

If not, does being undeclared or undecided hurt my admissions chances?

The short answer to both questions is YES, your declared major or the specific program to which you are applying can have a significant impact on your acceptance chances.

Even if schools pretend otherwise, the statistics bear this out (as shown later in this article).

Students who demonstrate interest in different majors/programs have widely different acceptance rates at certain colleges.

I've listed 5 case studies of different schools below to illustrate how the way in which you choose a major for your college application can improve or decrease your admissions chances.

UCLA

At UCLA , different programs have vastly different admissions rates (shown below).

UCLA

Additionally, even within the pool of students interested solely in engineering, the School of Engineering explicitly evaluates students by the specific engineering major that they intend to pursue.

Harvard

At Harvard , students interested in “humanities” are admitted at almost double the rate as students interested in “engineering”:

Harvard

Carnegie Mellon (CMU)

At Carnegie Mellon (shown below), the acceptance rate of different programs ranges from 7% to 26%!

CMU

UC Berkeley

At UC Berkeley , applicants intending on studying “computer science” have an 8.5% acceptance rate, compared to 17% overall.

Cornell

At Cornell , each application is individually considered by the specific college that a student applies to.

As Cornell Vice Provost of Enrollment Jason Locke stated in The Cornell Sun,

"Unlike many other colleges, which review all applications from a central undergraduate admissions office, Cornell has a 'somewhat unique system,' according to Locke.

Once an application is submitted, it will be given to the one — and only — college or school that the student is applying to, where his or her material will undergo what Locke called a 'first review.'"

This leads to wildly different outcomes for students who apply to different schools. For example, the undergraduate acceptance rate for Cornell's School of Industrial & Labor Relations was triple the rate of applicants to the College of Arts and Sciences.


What causes this statistical difference?

There are two main factors which make your choice of intended field of study important on your college application.

  1. Colleges have different strengths. Johns Hopkins’ world-renowned Biomedical Engineering (BME) program is much stronger than its English department. MIT’s Computer Science (CS) department is much stronger than its History department. Thus, more students interested in BME will apply to Johns Hopkins, and it will be harder to distinguish yourself as an applicant interested in BME. Same goes for applying to MIT as a CS major.

  2. Colleges have different weaknesses . Every program or school that a college offers represents a significant investment of time, money, and resources. Applicants that have the potential to dramatically improve relatively weaker programs (e.g. English at Johns Hopkins, or History at MIT) offer a larger marginal return on being admitted than students who would have to be literally world-class (e.g. win a Nobel Prize) to make a noticeably lasting impact on their stronger departments.

Use this knowledge to your benefit!

Most colleges will allow you to switch majors after enrolling.

If you can frame your application to provide an unmet need or fill spots in an under-enrolled program, you can greatly increase your admissions chances .

To learn more about college admissions from Ivy League students who’ve successfully gone through the process themselves, check out the services we offer here

Acceptance Rates of the 22 Best Colleges in the World

June 02, 2020 by Veritas Essays Team | Acceptance Rates, Harvard, Stanford, Yale, Ivy League, NYU, MIT, Duke, Notre Dame, NYU, Oxford, Cambridge, USC, UVA, Georgetown, Johns Hopkins, UCs, UC Berkeley, UCLA, University of Chicago


The 2019-2020 admissions cycle for the Class of 2024 was one of the most competitive ever , with more and more students from around the world applying to top universities and elite colleges with a limited number of spots.

The 2020-21 cycle is shaping up to be an even more competitive year for admissions to Ivy League schools and other top universities, especially with the uncertainty surrounding COVID-19. Read on to learn more about the admission rate of top colleges in the US and UK.

Ivy League Schools

Gates of Princeton

Harvard Acceptance Rate

The 2019-2020 Harvard acceptance rate was 4.9% . This was slightly higher than the previous year, which was 4.5% . A total of 40,248 students applied for 1,980 spots in the Class of 2024. (Source)

Yale Acceptance Rate

The 2019-2020 Yale acceptance rate was 6.5% . This was slightly higher than the previous year, which was 5.9% . A total of 35,220 students applied for 2,304 spots in the Class of 2024. (Source)

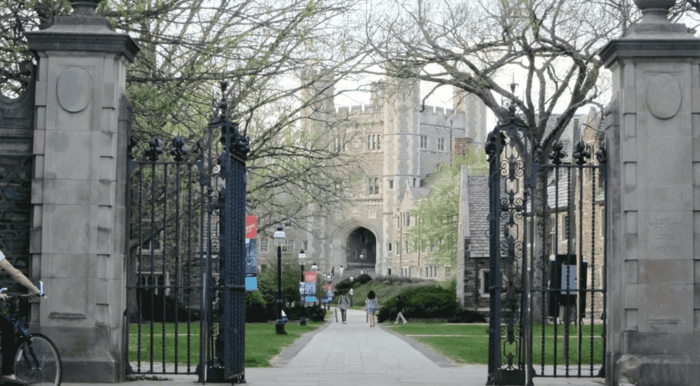
Princeton Acceptance Rate

The 2019-2020 Princeton acceptance rate was 5.6% . This was slightly lower than the previous year, which was 5.8% . A total of 32,836 students applied for 1,823 spots in the Class of 2024. (Source)

Columbia Acceptance Rate

The 2019-2020 Columbia acceptance rate was 6.1% . This was higher than the previous year, which was 5.1% . A total of 40,084 students applied for 2,465 spots in the Class of 2024. (Source)

Penn Acceptance Rate

The 2019-2020 University of Pennsylvania acceptance rate was 8.1% . This was slightly higher than the previous year, which was 7.4% . (Source)

Brown Acceptance Rate

The 2019-2020 Brown acceptance rate was 6.9% . This was slightly higher than the previous year, which was 6.6% . A total of 36,794 students applied for 2,533 spots in the Class of 2024. (Source)

Dartmouth Acceptance Rate

The 2019-2020 Dartmouth acceptance rate was 8.8% . This was higher than the previous year, which was 7.9%% . A total of 21,394 students applied for 1,881 spots in the Class of 2024. (Source)

Cornell Acceptance Rate

The 2019-2020 Cornell acceptance rate has not been published, as part of a move by administrators to not release regular decision results until the following admissions cycle. However, Cornell did release its Early Decision results, which showed an ED acceptance rate of 23.8% . This was higher than the previous year, which was 22.6% . A total of 6,615 students applied for 1,576 Early Decision spots in the Class of 2024. (Source)

Top US Colleges (Non-Ivy, Private)

Entrance to Stanford

Stanford Acceptance Rate

The 2019-2020 Stanford acceptance rate has not been published, as part of a move by administrators to not release acceptance rate statistics. However, Stanford did release its results for the previous year, which showed that 47,498 total students applied for 1,900 spots in the Class of 2023, for an acceptance rate of 4% . (Source)

MIT Acceptance Rate

The 2019-2020 MIT acceptance rate was 7.2% . This was slightly higher than the previous year, which was 6.6% . A total of 20,075 students applied for 1,457 spots in the Class of 2024. (Source)

USC Acceptance Rate

The 2019-2020 USC acceptance rate was 16% . This was significantly higher than the previous year, which was 11% . A total of 60,000 students applied for 9,500 spots in the Class of 2024. (Source)

Duke Acceptance Rate

The 2019-2020 Duke acceptance rate was 7.7 %. This was the same as the previous year, which was 7.7% . A total of 39,783 students applied for 3,057 spots in the Class of 2024. (Source)

Notre Dame Acceptance Rate

The 2019-2020 Notre Dame acceptance rate was 16.5% . This was higher than the previous year, which was 15.4% . A total of 21,270 students applied for 3,507 spots in the Class of 2024. (Source)

NYU Acceptance Rate

The 2019-2020 NYU acceptance rate was 15% . This was lower than the previous year, which was 16% . A total of 85,000 students applied for 13,000 spots in the Class of 2024. (Source)

Georgetown Acceptance Rate

The 2019-2020 Georgetown acceptance rate was 15% . This was higher than the previous year, which was 14.1% . A total of 23,318 students applied for 3,309 spots in the Class of 2024. (Source)

Johns Hopkins Acceptance Rate

The 2019-2020 Johns Hopkins University acceptance rate was 8.8% . This was slightly lower than the previous year, which was 9.2% . A total of 27,256 students applied for 2,604 spots in the Class of 2024. (Source)

University of Chicago Acceptance Rate

The 2019-2020 University of Chicago acceptance rate was 6.2% . This was slightly higher than the previous year, which was 5.9% . A total of 34,400 students applied for 2,130 spots in the Class of 2024. (Source)

Top US Colleges (Public)

UCLA

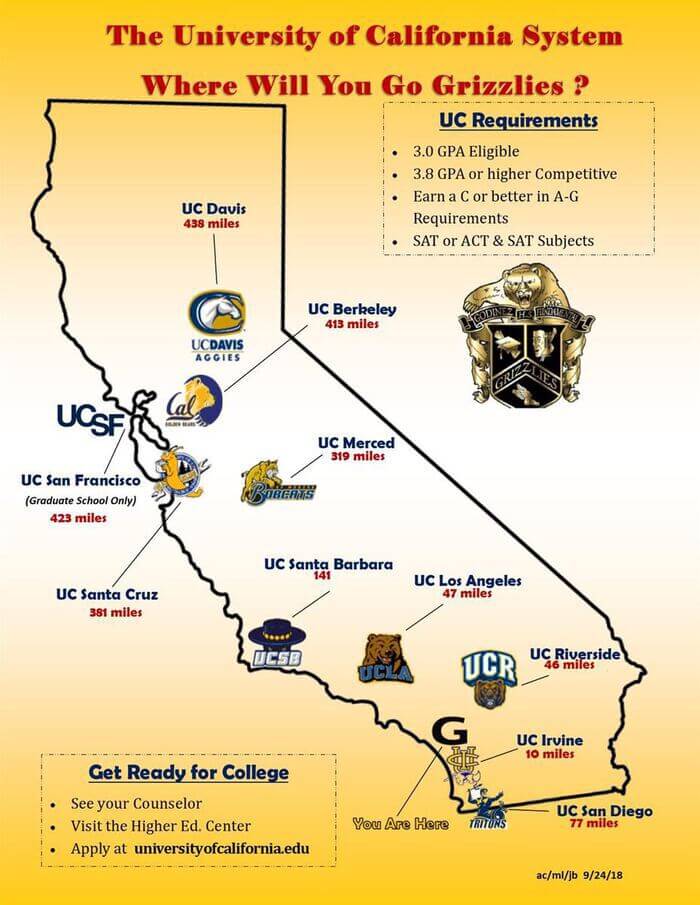
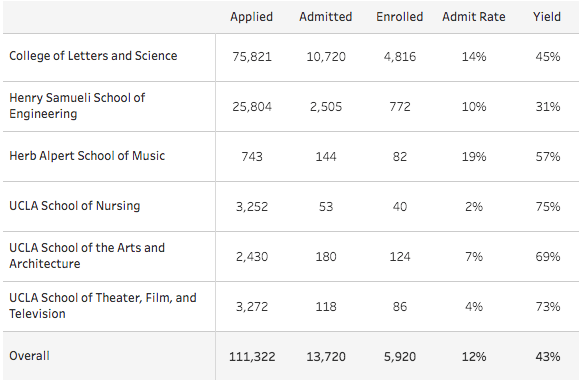
UCLA Acceptance Rate

The 2019-2020 UCLA acceptance rate has not yet been published. The previous year, the acceptance rate was 12.4% . A total of 108,837 students applied for the Class of 2024, which was slightly lower than the previous year at 111,306. (Source 1) (Source 2)

UC Berkeley Acceptance Rate

The 2019-2020 UC acceptance rate has not yet been published. The previous year, the acceptance rate was 16.4% . A total of 88,026 students applied for the Class of 2024, which was slightly higher than the previous year at 87,393. (Source 1) (Source 2)

UVA Acceptance Rate

The 2019-2020 UVA acceptance rate was 20.5% . This was significantly lower than the previous year, which was 24.3% . A total of 40,971 students applied for 8,420 spots in the Class of 2024. (Source)

Oxbridge

Oxford

Oxford Acceptance Rate

The 2019-2020 Oxford acceptance rate has not been published. For the previous year, there were 23,020 total applications for 3,889 spots in the Class of 2023, for an acceptance rate of 16.9% . (Source)

Cambridge Acceptance Rate

The 2019-2020 Cambridge acceptance rate has not been published. For the previous year, there were 19,359 total applications for 4,694 spots in the Class of 2023, for an acceptance rate of 18.2% . (Source)


If you want direct feedback on your essays from current Ivy League students, or want to work 1-on-1 with an experienced mentor to craft your application, learn more about us here or click here to schedule a free 20-minute consultation