Posts under MIT

<<< Back to Blog Home
Search Our Blog

What Do Colleges Look for in Applicants?

Learn How to Best Focus Your Application for Your Dream School

July 03, 2020 by Veritas Essays Team | Inside Info, Stanford, MIT, UC Berkeley, Yale, Ivy League, UCs


What is a competitive college GPA?

What is the GPA needed for Stanford? What is the GPA needed for Yale, or the GPA needed for MIT?

What are the best ECs for college?

What are Stanford's requirements for admission? What are the UC admissions requirements for each school?

What do colleges look for in students? What do Ivy League schools look for? What are the college admissions requirements for my dream school?

How do colleges decide who gets in?!?!

These are all great questions!

And answering them may seem overwhelming at first.

A lot of people on the Internet claim to miraculously have all the answers. Somehow, they've synthesized the collective knowledge, opinions, and beliefs of thousands of admissions officers across the US.

I, however, am unfortunately not a mind-reader -- I will openly admit that I know the answer to very few of these questions. Yes, I can tell you generally what ECs are preferred, how to write a great essay, what you should be focusing on in high school, and specifics for my alma mater (Harvard).

But to immediately know how an MIT admissions officer I've never met will weigh your specific community service experience against working a part-time job? Impossible (unless of course you're one of these mind-reading college consultants found around the Internet).

Does that mean there's no way to know the answers to these questions?

No.

In fact, there's an even better solution.

What if you could directly ask your dream college how it decides who'll be admitted?

Amazingly, you can.

You just need to know where to look.

That's because the federal government mandates that accredited colleges report this information every year to the National Center for Education Statistics.

This data is conveniently collected by College Data into a neat admissions database. Thus, I’ve pulled a few interesting examples for you below (Stanford, Yale, MIT, and UC Berkeley).

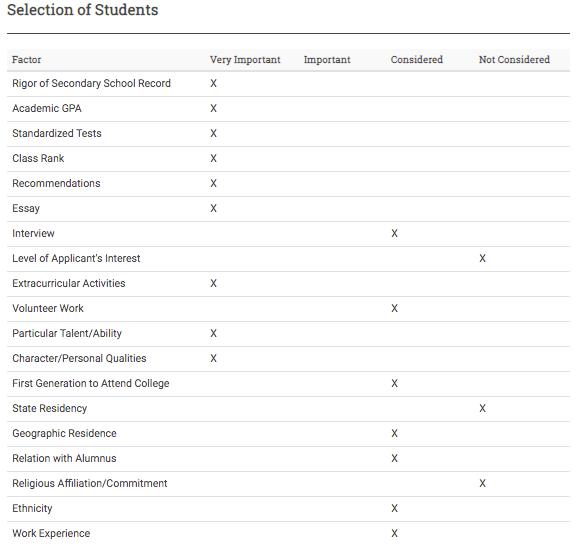
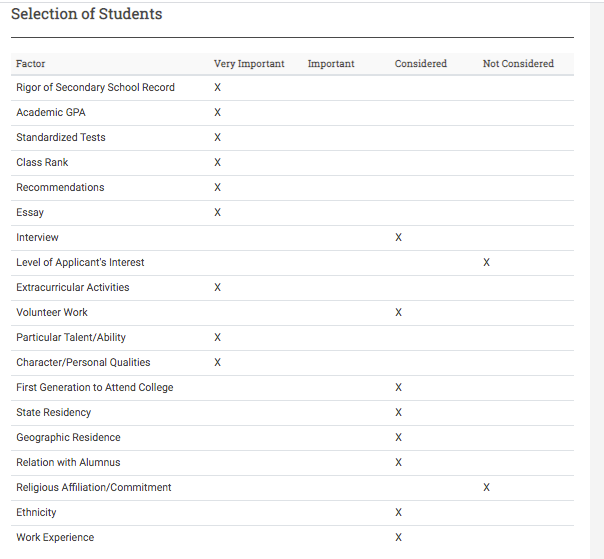
These are the factors that Stanford uses to grade applicants, as well as their relative importance:

Personal Traits

Collectively, this table (as well as the ones below) show that a much wider variety of factors beyond just GPA (essays, extracurriculars, rec letters, etc.) go into your admissions decision, and how each will be weighted differently by different colleges.

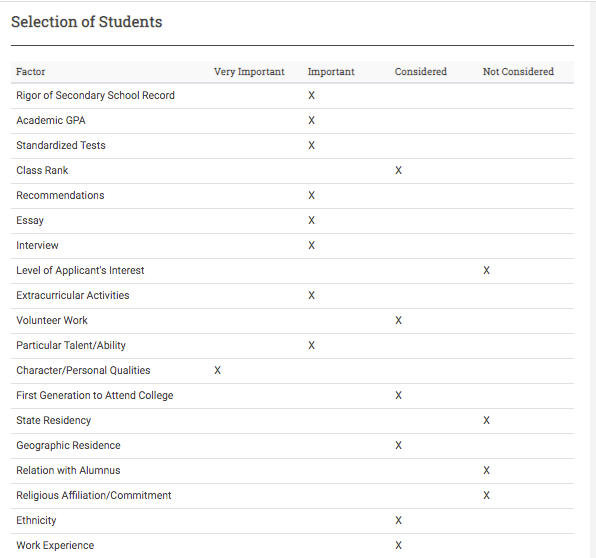
These are MIT’s preferences:

Personal Traits

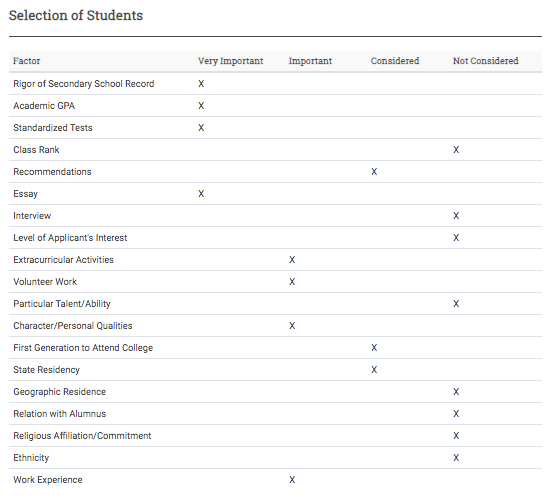
And here is the corresponding chart for UC Berkeley :

Personal Traits

As you can see, there are a ton of factors that influence your admissions decision.

Additionally, each school has its own unique culture which will be reflected in how it preferentially evaluates different candidates.

Finally, here is the relevant chart for Yale :

Personal Traits

It's important to make sure that in each of your applications to these schools, you highlight the elements of your application that correspond to those most prioritized by that school.

An amusing anecdote from Microsoft co-founder Bill Gates perfectly illustrates this point:

As a senior, he [Bill Gates] applied only to three colleges — Harvard, Yale, and Princeton — and he took different approaches to each.

"I was born to apply for college," he said, fully aware of his ability to ace meritocratic processes.

For Yale he cast himself as an aspiring political type and emphasized the month he had spent in Washington as a congressional page. For Princeton, he focused only on his desire to be a computer engineer. And for Harvard, he said his passion was math. He had also considered MIT, but at the last moment blew off the interview to play pinball.

He was accepted to all three, and chose Harvard. "There are going to be some guys at Harvard who are smarter than you,"" Allen warned him. Gates replied, "No way! No way!"

The College Data website also lays out the requirements and benchmarks for admission to each school.

Here are the admission statistics of students admitted to Stanford :

Personal Traits

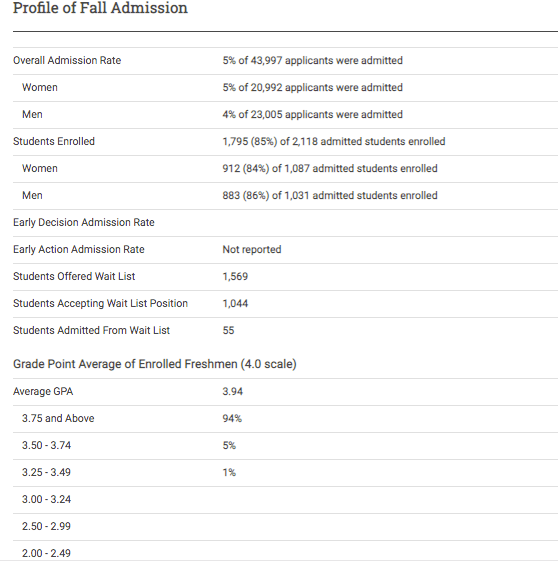
If you fit the profile of the typical student admitted to the school you want to go to, that's amazing news -- Congrats! You now just need to polish up the rest of your application.

If perfecting your essays is something still on your bucket list, you've come to the right place.

If you want direct 1-on-1 mentorship from top Ivy League students, or a review of your materials before you press submit, consider signing up for a free 20-minute consultation or learn more about how we can help you here .

Acceptance Rates of the 22 Best Colleges in the World

June 02, 2020 by Veritas Essays Team | Acceptance Rates, Harvard, Stanford, Yale, Ivy League, NYU, MIT, Duke, Notre Dame, NYU, Oxford, Cambridge, USC, UVA, Georgetown, Johns Hopkins, UCs, UC Berkeley, UCLA, University of Chicago


The 2019-2020 admissions cycle for the Class of 2024 was one of the most competitive ever , with more and more students from around the world applying to top universities and elite colleges with a limited number of spots.

The 2020-21 cycle is shaping up to be an even more competitive year for admissions to Ivy League schools and other top universities, especially with the uncertainty surrounding COVID-19. Read on to learn more about the admission rate of top colleges in the US and UK.

Ivy League Schools

Gates of Princeton

Harvard Acceptance Rate

The 2019-2020 Harvard acceptance rate was 4.9% . This was slightly higher than the previous year, which was 4.5% . A total of 40,248 students applied for 1,980 spots in the Class of 2024. (Source)

Yale Acceptance Rate

The 2019-2020 Yale acceptance rate was 6.5% . This was slightly higher than the previous year, which was 5.9% . A total of 35,220 students applied for 2,304 spots in the Class of 2024. (Source)

Princeton Acceptance Rate

The 2019-2020 Princeton acceptance rate was 5.6% . This was slightly lower than the previous year, which was 5.8% . A total of 32,836 students applied for 1,823 spots in the Class of 2024. (Source)

Columbia Acceptance Rate

The 2019-2020 Columbia acceptance rate was 6.1% . This was higher than the previous year, which was 5.1% . A total of 40,084 students applied for 2,465 spots in the Class of 2024. (Source)

Penn Acceptance Rate

The 2019-2020 University of Pennsylvania acceptance rate was 8.1% . This was slightly higher than the previous year, which was 7.4% . (Source)

Brown Acceptance Rate

The 2019-2020 Brown acceptance rate was 6.9% . This was slightly higher than the previous year, which was 6.6% . A total of 36,794 students applied for 2,533 spots in the Class of 2024. (Source)

Dartmouth Acceptance Rate

The 2019-2020 Dartmouth acceptance rate was 8.8% . This was higher than the previous year, which was 7.9%% . A total of 21,394 students applied for 1,881 spots in the Class of 2024. (Source)

Cornell Acceptance Rate

The 2019-2020 Cornell acceptance rate has not been published, as part of a move by administrators to not release regular decision results until the following admissions cycle. However, Cornell did release its Early Decision results, which showed an ED acceptance rate of 23.8% . This was higher than the previous year, which was 22.6% . A total of 6,615 students applied for 1,576 Early Decision spots in the Class of 2024. (Source)

Top US Colleges (Non-Ivy, Private)

Entrance to Stanford

Stanford Acceptance Rate

The 2019-2020 Stanford acceptance rate has not been published, as part of a move by administrators to not release acceptance rate statistics. However, Stanford did release its results for the previous year, which showed that 47,498 total students applied for 1,900 spots in the Class of 2023, for an acceptance rate of 4% . (Source)

MIT Acceptance Rate

The 2019-2020 MIT acceptance rate was 7.2% . This was slightly higher than the previous year, which was 6.6% . A total of 20,075 students applied for 1,457 spots in the Class of 2024. (Source)

USC Acceptance Rate

The 2019-2020 USC acceptance rate was 16% . This was significantly higher than the previous year, which was 11% . A total of 60,000 students applied for 9,500 spots in the Class of 2024. (Source)

Duke Acceptance Rate

The 2019-2020 Duke acceptance rate was 7.7 %. This was the same as the previous year, which was 7.7% . A total of 39,783 students applied for 3,057 spots in the Class of 2024. (Source)

Notre Dame Acceptance Rate

The 2019-2020 Notre Dame acceptance rate was 16.5% . This was higher than the previous year, which was 15.4% . A total of 21,270 students applied for 3,507 spots in the Class of 2024. (Source)

NYU Acceptance Rate

The 2019-2020 NYU acceptance rate was 15% . This was lower than the previous year, which was 16% . A total of 85,000 students applied for 13,000 spots in the Class of 2024. (Source)

Georgetown Acceptance Rate

The 2019-2020 Georgetown acceptance rate was 15% . This was higher than the previous year, which was 14.1% . A total of 23,318 students applied for 3,309 spots in the Class of 2024. (Source)

Johns Hopkins Acceptance Rate

The 2019-2020 Johns Hopkins University acceptance rate was 8.8% . This was slightly lower than the previous year, which was 9.2% . A total of 27,256 students applied for 2,604 spots in the Class of 2024. (Source)

University of Chicago Acceptance Rate

The 2019-2020 University of Chicago acceptance rate was 6.2% . This was slightly higher than the previous year, which was 5.9% . A total of 34,400 students applied for 2,130 spots in the Class of 2024. (Source)

Top US Colleges (Public)

UCLA

UCLA Acceptance Rate

The 2019-2020 UCLA acceptance rate has not yet been published. The previous year, the acceptance rate was 12.4% . A total of 108,837 students applied for the Class of 2024, which was slightly lower than the previous year at 111,306. (Source 1) (Source 2)

UC Berkeley Acceptance Rate

The 2019-2020 UC acceptance rate has not yet been published. The previous year, the acceptance rate was 16.4% . A total of 88,026 students applied for the Class of 2024, which was slightly higher than the previous year at 87,393. (Source 1) (Source 2)

UVA Acceptance Rate

The 2019-2020 UVA acceptance rate was 20.5% . This was significantly lower than the previous year, which was 24.3% . A total of 40,971 students applied for 8,420 spots in the Class of 2024. (Source)

Oxbridge

Oxford

Oxford Acceptance Rate

The 2019-2020 Oxford acceptance rate has not been published. For the previous year, there were 23,020 total applications for 3,889 spots in the Class of 2023, for an acceptance rate of 16.9% . (Source)

Cambridge Acceptance Rate

The 2019-2020 Cambridge acceptance rate has not been published. For the previous year, there were 19,359 total applications for 4,694 spots in the Class of 2023, for an acceptance rate of 18.2% . (Source)


If you want direct feedback on your essays from current Ivy League students, or want to work 1-on-1 with an experienced mentor to craft your application, learn more about us here or click here to schedule a free 20-minute consultation