Posts under Duke

<<< Back to Blog Home
Search Our Blog

Why is it So Hard Getting Into a Top College?

July 09, 2020 by Veritas Essays Team | Early Action, Early Decision, Acceptance Rates, Ivy League, Stanford, Harvard, University of Chicago, Cornell, Dartmouth, UPenn, Duke


Why do top colleges and universities have much lower acceptance rates than they did only a decade ago?

It’s a tragic saga of prestige, tradition, statistics, and a decade-long race to the bottom. Watch it slowly unfold in the charts below:

Image

In the “good ole’ days” depicted on the left , your last name was your college application. Today (on the right ), the high school students competing with you are basically curing cancer.

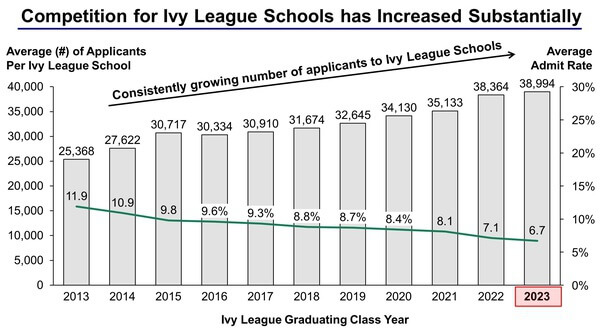
Unfortunately, the number of spots at top colleges has not kept pace with the explosion of applications:
Image

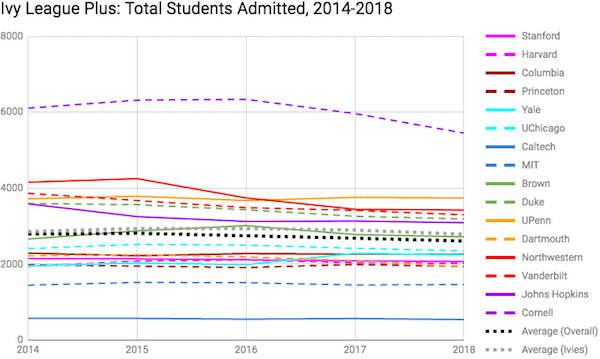
And yet the total number of students admitted to top colleges has remained stagnant :
Image

This isn’t just a phenomenon of “top” colleges — this problem occurs across the board for all US universities:

Image

As the saying goes, scarcity creates value.

So from the perspective of top colleges, this surge in demand has been a blessing rather than a curse.

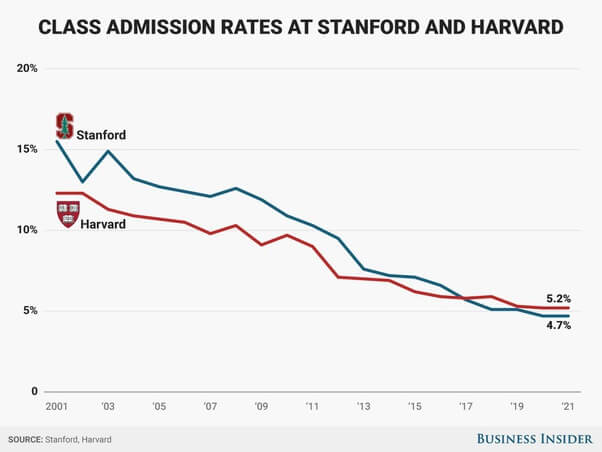
Consider the two most prestigious colleges in America — Stanford and Harvard.

Once upon a time, over 1 in 10 students who applied to Harvard and Stanford got in (2001). Now, that number is less than 1 in 20 students.
Image

Both elite schools have fought a race to the bottom in terms of acceptance rates, closely tailing one another for the “top” (or “bottom”) spot.

At the same time, the number that matters most to colleges for prestige — Yield Rate — steadily increased. Yield Rate is the percentage of accepted students that choose to enroll in your institution.

Luckily for top colleges, low acceptance rates and high yields go hand in hand:
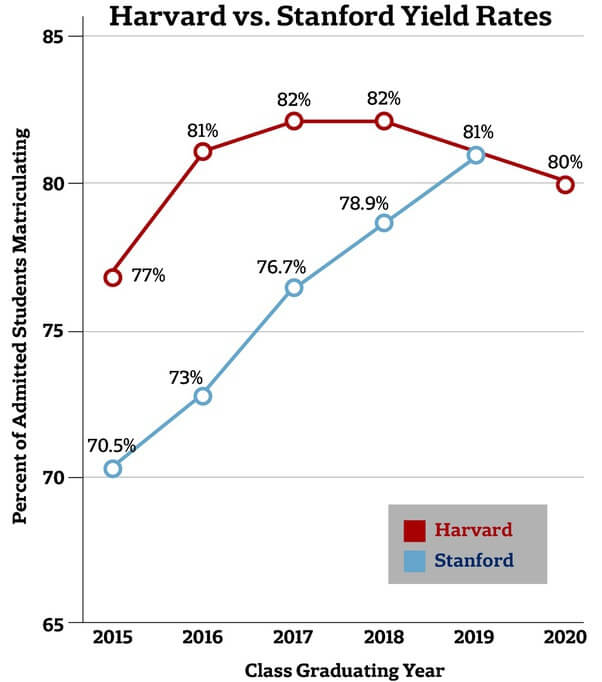
Image

The reason why top colleges have much lower acceptance rates than they did a decade ago is because prestige is relative.

If you’re the dean of the only college in your division with a double digit acceptance rate, then you can expect to be reprimanded by your Board of Trustees for failing to uphold the prestige and exclusivity of your college’s brand. Angry alumni who see the value of their diploma depreciating relative to the peers from other institutions will demand action.

And that’s why you see the craziest drops in acceptance rates for institutions that lagged behind their peers in prestige a decade ago.

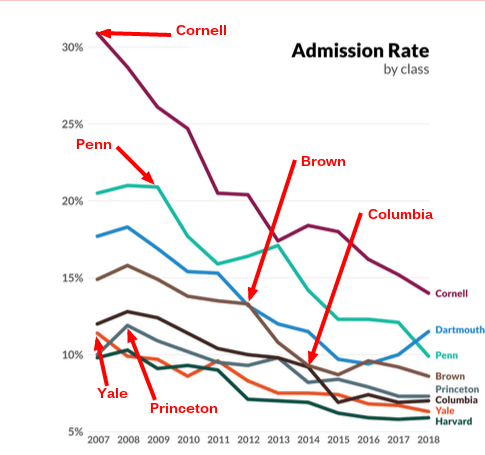
Consider the Ivies:
Image

Note the most dramatic drops in Ivy League acceptance rates come from schools like Cornell, Penn, Brown, and Dartmouth, which are typically considered the “less prestigious” Ivies.

Their acceptance rates have plummeted from a completely reasonable 15–35% in 2007 to an intimidating <15% by 2018 .

That’s because these “less prestigious” top universities have the most “catching up” to do.

Deflating acceptance rates while filling your incoming class was difficult to do 1–2 decades ago. But now, thanks to...

  1. The Internet

  2. Standardization of the Common App/Coalition App/Universal App

  3. Higher number of international applicants

...there is enough demand for any college to achieve their desired prestigiously low acceptance rate by simply spending enough on marketing/ad flyers/outreach.

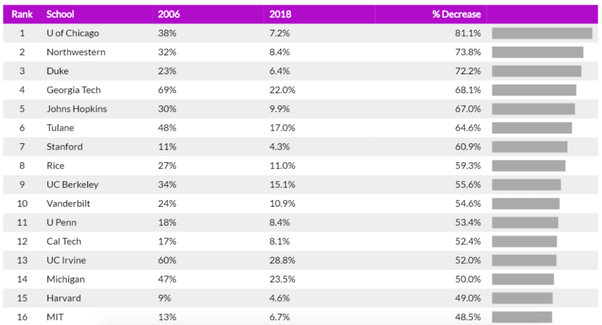
The table below shows the 16 colleges with the largest decrease in acceptance rates over the past decade:
Image

You’ll note that most of these schools are good, but not in the upper echelon of “elite” schools.

These are schools like the University of Chicago, Northwestern, Duke, Georgia Tech, Michigan, Rice, Vanderbilt, etc.

For these schools, a low acceptance rate is a fast track to prestige, something that could otherwise only be achieved through hundreds of years of achievement.

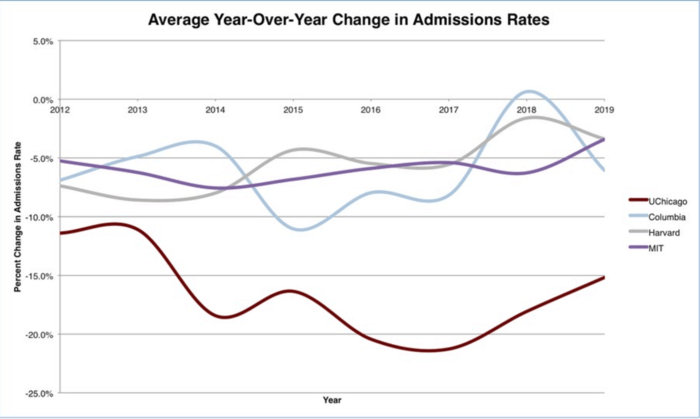
So while all elite colleges have seen their admissions rates decrease over the past decade, colleges like the University of Chicago have been able to attain roughly comparable admissions selectivity as Ivy League schools by simply out-pacing more "prestigious" colleges at lowering their acceptance rates.
Image

To summarize: Top colleges have much lower acceptance rates than they did a decade ago because there’s too many applicants and not enough spots.

This benefits colleges by making their diplomas more valuable, and thus there have been no substantial efforts to resolve this race to the bottom.

Acceptance Rates of the 22 Best Colleges in the World

June 02, 2020 by Veritas Essays Team | Acceptance Rates, Harvard, Stanford, Yale, Ivy League, NYU, MIT, Duke, Notre Dame, NYU, Oxford, Cambridge, USC, UVA, Georgetown, Johns Hopkins, UCs, UC Berkeley, UCLA, University of Chicago


The 2019-2020 admissions cycle for the Class of 2024 was one of the most competitive ever , with more and more students from around the world applying to top universities and elite colleges with a limited number of spots.

The 2020-21 cycle is shaping up to be an even more competitive year for admissions to Ivy League schools and other top universities, especially with the uncertainty surrounding COVID-19. Read on to learn more about the admission rate of top colleges in the US and UK.

Ivy League Schools

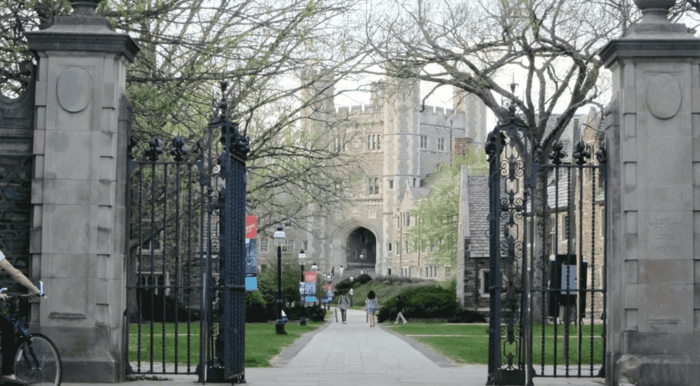
Gates of Princeton

Harvard Acceptance Rate

The 2019-2020 Harvard acceptance rate was 4.9% . This was slightly higher than the previous year, which was 4.5% . A total of 40,248 students applied for 1,980 spots in the Class of 2024. (Source)

Yale Acceptance Rate

The 2019-2020 Yale acceptance rate was 6.5% . This was slightly higher than the previous year, which was 5.9% . A total of 35,220 students applied for 2,304 spots in the Class of 2024. (Source)

Princeton Acceptance Rate

The 2019-2020 Princeton acceptance rate was 5.6% . This was slightly lower than the previous year, which was 5.8% . A total of 32,836 students applied for 1,823 spots in the Class of 2024. (Source)

Columbia Acceptance Rate

The 2019-2020 Columbia acceptance rate was 6.1% . This was higher than the previous year, which was 5.1% . A total of 40,084 students applied for 2,465 spots in the Class of 2024. (Source)

Penn Acceptance Rate

The 2019-2020 University of Pennsylvania acceptance rate was 8.1% . This was slightly higher than the previous year, which was 7.4% . (Source)

Brown Acceptance Rate

The 2019-2020 Brown acceptance rate was 6.9% . This was slightly higher than the previous year, which was 6.6% . A total of 36,794 students applied for 2,533 spots in the Class of 2024. (Source)

Dartmouth Acceptance Rate

The 2019-2020 Dartmouth acceptance rate was 8.8% . This was higher than the previous year, which was 7.9%% . A total of 21,394 students applied for 1,881 spots in the Class of 2024. (Source)

Cornell Acceptance Rate

The 2019-2020 Cornell acceptance rate has not been published, as part of a move by administrators to not release regular decision results until the following admissions cycle. However, Cornell did release its Early Decision results, which showed an ED acceptance rate of 23.8% . This was higher than the previous year, which was 22.6% . A total of 6,615 students applied for 1,576 Early Decision spots in the Class of 2024. (Source)

Top US Colleges (Non-Ivy, Private)

Entrance to Stanford

Stanford Acceptance Rate

The 2019-2020 Stanford acceptance rate has not been published, as part of a move by administrators to not release acceptance rate statistics. However, Stanford did release its results for the previous year, which showed that 47,498 total students applied for 1,900 spots in the Class of 2023, for an acceptance rate of 4% . (Source)

MIT Acceptance Rate

The 2019-2020 MIT acceptance rate was 7.2% . This was slightly higher than the previous year, which was 6.6% . A total of 20,075 students applied for 1,457 spots in the Class of 2024. (Source)

USC Acceptance Rate

The 2019-2020 USC acceptance rate was 16% . This was significantly higher than the previous year, which was 11% . A total of 60,000 students applied for 9,500 spots in the Class of 2024. (Source)

Duke Acceptance Rate

The 2019-2020 Duke acceptance rate was 7.7 %. This was the same as the previous year, which was 7.7% . A total of 39,783 students applied for 3,057 spots in the Class of 2024. (Source)

Notre Dame Acceptance Rate

The 2019-2020 Notre Dame acceptance rate was 16.5% . This was higher than the previous year, which was 15.4% . A total of 21,270 students applied for 3,507 spots in the Class of 2024. (Source)

NYU Acceptance Rate

The 2019-2020 NYU acceptance rate was 15% . This was lower than the previous year, which was 16% . A total of 85,000 students applied for 13,000 spots in the Class of 2024. (Source)

Georgetown Acceptance Rate

The 2019-2020 Georgetown acceptance rate was 15% . This was higher than the previous year, which was 14.1% . A total of 23,318 students applied for 3,309 spots in the Class of 2024. (Source)

Johns Hopkins Acceptance Rate

The 2019-2020 Johns Hopkins University acceptance rate was 8.8% . This was slightly lower than the previous year, which was 9.2% . A total of 27,256 students applied for 2,604 spots in the Class of 2024. (Source)

University of Chicago Acceptance Rate

The 2019-2020 University of Chicago acceptance rate was 6.2% . This was slightly higher than the previous year, which was 5.9% . A total of 34,400 students applied for 2,130 spots in the Class of 2024. (Source)

Top US Colleges (Public)

UCLA

UCLA Acceptance Rate

The 2019-2020 UCLA acceptance rate has not yet been published. The previous year, the acceptance rate was 12.4% . A total of 108,837 students applied for the Class of 2024, which was slightly lower than the previous year at 111,306. (Source 1) (Source 2)

UC Berkeley Acceptance Rate

The 2019-2020 UC acceptance rate has not yet been published. The previous year, the acceptance rate was 16.4% . A total of 88,026 students applied for the Class of 2024, which was slightly higher than the previous year at 87,393. (Source 1) (Source 2)

UVA Acceptance Rate

The 2019-2020 UVA acceptance rate was 20.5% . This was significantly lower than the previous year, which was 24.3% . A total of 40,971 students applied for 8,420 spots in the Class of 2024. (Source)

Oxbridge

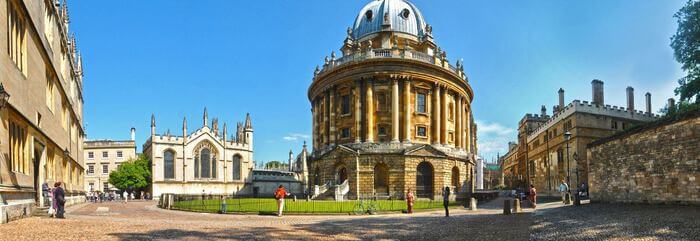
Oxford

Oxford Acceptance Rate

The 2019-2020 Oxford acceptance rate has not been published. For the previous year, there were 23,020 total applications for 3,889 spots in the Class of 2023, for an acceptance rate of 16.9% . (Source)

Cambridge Acceptance Rate

The 2019-2020 Cambridge acceptance rate has not been published. For the previous year, there were 19,359 total applications for 4,694 spots in the Class of 2023, for an acceptance rate of 18.2% . (Source)


If you want direct feedback on your essays from current Ivy League students, or want to work 1-on-1 with an experienced mentor to craft your application, learn more about us here or click here to schedule a free 20-minute consultation